Issue #2: Beyond Keto: The Real Science of Insulin Resistance
The usual story on Insulin Resistance:
You eat sugar or carbohydrates which break down to sugar and that gets into your bloodstream. Your body makes the hormone insulin to deal with the sugar. Insulin brings the sugar into the liver or muscles to make glycogen (the storage form of carbohydrate in the body) and it also takes excess sugar into the fat cells or the liver to make triglycerides (the storage form of fat in the body). Bottom line, too many carbs raise insulin; insulin makes you fat, ergo, cut the carbs, you have less insulin, you lose fat. The End.
But leaving the narrative there is akin to learning the first 3 letters of the alphabet and then expecting to be able to read words and sentences. To be literate in metabolic health, we need the rest of the alphabet.
When you increase your intake of carbs/sugar, your pancreas responds by making more insulin. If you’re consuming too many carbs, then you flood the bloodstream with insulin. Over time, the insulin response becomes less effective or even defective. (Think of mass production of goods in the market–quantity of goods goes up at the expense of quality). This insufficient insulin response as you continue to consume carbs results in your body cranking up insulin production even more, leading to hyperinsulinemia (high blood levels of insulin). Since the mass-produced insulin is not working the way it should, we have a state of insulin resistance.
Here’s a more detailed look at what happens:
- Normal state: insulin binds to its receptor, launches a signaling cascade (IRS → PI3K → Akt), moves glucose transporters (GLUT4) to the cell surface, and suppresses fat breakdown in adipose tissue.
- Insulin resistance: lipid intermediates like diacylglycerols (DAGs) and ceramides accumulate in liver and muscle, blocking those signals. Glucose can’t get in efficiently, and fat cells stop listening to the command to hold onto triglycerides.
Two problems emerge:
- Hyperinsulinemia. Imagine you (as a unit of insulin) are tasked with taking out the trash (glucose) each night at work, which, under normal circumstances, you do on your own with ease. But as the body becomes insulin resistant, you can’t handle the load alone—so more “colleagues” (insulin molecules) are recruited. Two people are required to do the job, then five, then ten. Every morning, the trash can (blood) still looks empty (low glucose), so everyone assumes things are fine. But the hidden cost is that it now takes ten times the effort to keep appearances normal. One day, even fifteen people can’t empty the can. That’s when the trash piles up—and glucose finally shows up in the blood. To the outside world, diabetes looks like it appeared “suddenly,” but in truth, your body has been straining for years. We simply never looked for the signs: elevated fasting insulin, rising HOMA-IR, or subtle shifts in triglycerides.
2. FFA Spillover. This next step is crucial and what a lot of people miss. Recall that when insulin is present in the bloodstream, it promotes pushing glucose into cells and lipogenesis (making fats). When the insulin isn’t working–which is why we call it insulin resistance–less glucose is pushed into cells and you have relatively less lipogenesis. In fact, you have inappropriate lipolysis (the breaking down of fats) in this setting. Lipogenesis is still occurring (since insulin is on board) but lipolysis is also happening (because insulin’s action is insufficient to suppress it). Normally, lipolysis releases fats in the form of triglycerides (or TAGS–triacylglycerols), which is essentially 3 fatty acid molecules capped by a glycerol molecule. This capping effect renders the fat non-toxic. But with insulin resistance we have the release of free fatty acids (FFA, sometimes called Non-Esterified Fatty Acids or NEFA)–basically uncapped fat molecules–which are very toxic and can damage cell structures. Other toxic lipids (fat products) are also produced, such as ceramides and diacylglycerols (DAGS–think “DAGGERS” for their toxicity. More in section below on Lipid Spillover).
So with insulin resistance, we have: 1) excess glucose in the bloodstream (because the insulin couldn’t effectively get it into cells), 2) free fatty acids (FFAs) and 3) other lipid species like ceramides and DAGs. All 3 are damaging to cells.
What about Fats? FYI…
When you eat fats they are absorbed after digestion and are loaded on lipoproteins in the small intestines. These enter the lymph and eventually dump into the bloodstream via the thoracic duct. From there, circulating lipoproteins deliver fats, cholesterol and fat-soluble nutrients to different parts of the body for energy and synthetic processes (making cell membranes, for example). Excess fat eventually gets stored in fat tissue–even in low insulin states.
Okay, time to zoom out a little. Before we go any further, let’s look at how our bodies are designed. Just like your car, your body has a fuel meter. Your tank is full, empty or somewhere in between. This context is very important in understanding metabolism. Let’s say you start with an empty tank and fill it at the pump. Let’s assume in this thought experiment that the pump can travel with the car. As fuel enters the car, it begins to move. Any excess fuel that is not directly used for powering the engine is stored in the gas tank. At some point, the tank gets filled and excess fuel from the pump now starts to spill onto the car and the road, causing a mess. As more and more fuel is spilt, it starts to corrode the wax finish and paint. It oxidizes and then clogs fuel injectors, fuel lines and filters, worsening the car’s performance.

Insulin resistance is a state where the fuel tanks in your body are full and the fuel (whatever kind–glucose, fat) starts to overflow into blood vessels and tissue.
So the simplistic message of ‘carbs make you sick’ is not only a dumbing down of the state of insulin resistance, it is also incomplete. Consuming more carbs (and fats) in the context of full fuel tanks will cause damaging spillage of glucose and lipids into blood, tissue, organs, and make you sick.
In clinical practice, insulin is seen mostly in the role of glucose regulation. In reality, its MAJOR physiological role is the suppression of lipolysis and this effect is more sensitive and more potent than its effects on glucose uptake. Insulin resistance in adipose tissue is defined by excessive FFA/NEFA release at a given concentration of insulin. These are then taken up by liver, muscle, pancreas, heart as ectopic lipids (fats deposited outside of subcutaneous fat tissue), leading to lipotoxicity. Yes, that means INFLAMMATION.
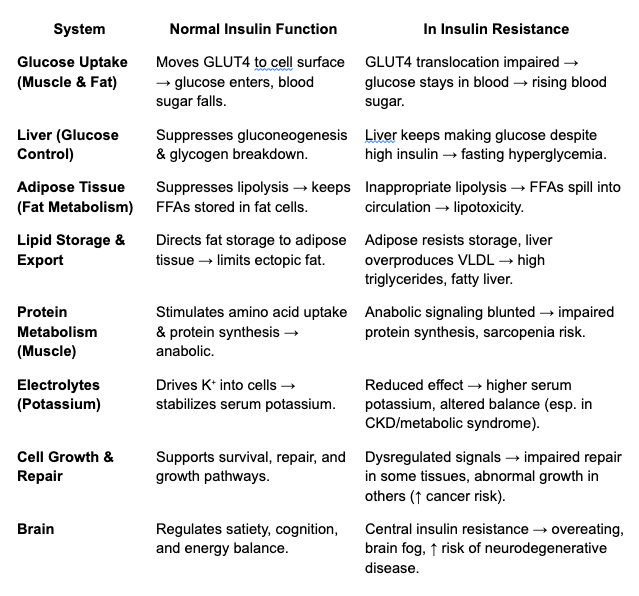
Insulin’s Main Functions:
Glucose Uptake & Use
- Stimulates muscle and fat cells to take up glucose by moving GLUT4 transporters to the cell surface.
- Promotes glycogen synthesis in liver and muscle (the body’s short-term energy storage).
Fat Metabolism
- Suppresses lipolysis (the breakdown of stored fat) in adipose tissue.
- Encourages storage of triglycerides when energy is abundant.
- Indirectly reduces circulating free fatty acids by keeping them locked away.
Protein Metabolism
- Stimulates amino acid uptake by cells.
- Enhances protein synthesis (insulin is anabolic, especially in muscle).
- Inhibits protein breakdown.
Liver Function
- Suppresses hepatic glucose output (gluconeogenesis and glycogen breakdown).
- Encourages glycogen synthesis.
- Modulates lipid synthesis and export (VLDL).
Electrolyte Balance
- Drives potassium into cells—one reason insulin is sometimes used in emergency medicine for dangerously high potassium levels.
Cell Growth & Repair
- Acts as a growth factor, overlapping with IGF-1 pathways.
- Important for wound healing and cell survival.
Brain Effects
- Though the brain doesn’t require insulin for glucose uptake, insulin still crosses the blood–brain barrier.
- It influences appetite regulation, cognition, and even mood. (More on Brain Insulin Resistance in Psyche)
To recap one more time so we’re clear: Insulin’s metabolic role is to keep excess fuels contained in the appropriate reservoirs (liver, muscles for glycogen; fat tissue for triglycerides) rather than have them spill into blood or tissues. This is a protective function–until we mess it up (see table below).
Lipid Spillover — DAGs, Ceramides, and Toxic Fat
With insulin resistance, adipocytes (fat cells) begin leaking free fatty acids (FFAs) into the bloodstream. These don’t just float harmlessly. They’re taken up by tissues that aren’t designed to store fat—muscle, liver, pancreas, even heart. Inside those cells, FFAs are re-packaged into lipid intermediates such as diacylglycerols (DAGs) and ceramides which aren’t inert byproducts; they actively sabotage metabolism.
- DAGs: These molecules activate protein kinase C (PKC), which interferes with insulin receptor substrate (IRS) signaling. Without that intact signal, GLUT4 transporters don’t move, glucose can’t enter muscle, and blood sugar rises.
- Ceramides: These lipids disrupt Akt signaling and damage mitochondria. The result is increased oxidative stress, impaired energy production, and a push toward cell death. In muscle, this blocks glucose uptake. In pancreatic β-cells, it means progressive failure of the very cells making insulin.
This lipotoxicity explains why insulin resistance spirals into full-blown disease:
- Nonalcoholic Fatty Liver Disease (NAFLD): Excess FFAs flood the liver, where DAGs interfere with insulin signaling and triglycerides accumulate. The result is fatty liver, which in turn worsens systemic insulin resistance.
- Type 2 Diabetes: Ceramides injure β-cells, undermining insulin secretion. The pancreas eventually can’t keep up with demand, and glucose finally escapes control.
- Cardiac Dysfunction: Hearts overloaded with FFAs accumulate toxic lipids in cardiac muscle. DAGs and ceramides impair contractility and mitochondrial function, contributing to heart failure.
- Atherosclerosis: FFAs and VLDL particles drive vascular damage and inflammation
- Muscle Metabolic Impairment: DAGs in muscle blunt glucose uptake, reducing fuel use during exercise and contributing to fatigue.
Not all fat is equally dangerous. Visceral fat is metabolically active, prone to lipolysis, and constantly leaks FFAs into the portal vein, flooding the liver with toxic precursors. Subcutaneous fat, by contrast, is more inert and protective: it stores triglycerides safely and is a natural fuel tank in your body.
In short: insulin resistance is not just “too much sugar in the blood.” It’s also ectopic fat —FFAs turning into DAGs and ceramides, jamming signaling pathways, and corroding the machinery of metabolism in liver, muscle, pancreas, and heart. That is why it drives so many seemingly unrelated diseases.
Glucose Spillover — When Sugar Becomes a Toxin
We’ve talked about lipid spillover, i.e. what happens when fat overflows its normal pathways and creates toxic intermediates.
But glucose has a spillover problem too.
Glucose itself isn’t “bad.” The issue is when there’s more glucose than your cells can safely process.
Under healthy conditions, cells quickly burn glucose for energy or store it as glycogen.
But when glucose levels stay high — especially in the setting of insulin resistance and chronic hyperinsulinemia — cells start shunting glucose into backup pathways that were never meant to run full-time.
These spillover pathways generate oxidative stress, inflammation, structural damage, and accelerated aging.
This is glucotoxicity.
1. Glucose enters cells faster than they can use it.
Insulin pushes glucose into many tissues (muscle, fat, liver).
In early insulin resistance, insulin levels climb higher and higher to maintain “normal” blood glucose.
But high insulin = high glucose influx into cells.
When the main pathways (glycolysis and glycogen storage) are saturated, glucose doesn’t stop entering.
It simply spills into secondary metabolic routes that create toxic by-products.
That’s where injury begins.
2. The Four Toxic Glucose Overflow Pathways
A) The Polyol Pathway: Sorbitol Build-Up → Oxidative Stress
When glucose is too high, some of it gets converted into sorbitol, a sugar alcohol.
Sorbitol causes problems because:
- it pulls water into cells → swelling and damage
- it uses up NADPH, needed for antioxidant recycling → more oxidative stress
Where it hits hardest: cells that take up glucose without needing insulin (retina, kidney, nerves). These cells use GLUT1 and GLUT3 transporters which are insulin independent.
This is why these tissues are often the first to suffer in diabetes.
B) PKC Activation: Glucose → DAG → PKC → Blood Vessel Damage
Too much glucose inside a cell can indirectly create more DAG, which activates PKC (protein kinase C).
Think of PKC as a switchboard that controls blood flow, inflammation, and vessel permeability.
When glucose overactivates PKC:
- blood vessels stiffen
- nitric oxide drops (less vasodilation)
- inflammatory signals rise
- small vessels become “leaky”
This pathway is central to diabetic microvascular injury.
C) The Hexosamine Pathway: “Sugar Tagging” to alter cell behavior
When glucose really piles up, some of it gets diverted into the hexosamine pathway, which produces a molecule called UDP-GlcNAc.
Cells use this molecule to add sugar “tags” onto proteins — a process called O-GlcNAcylation. These tags act as signals to change cell behavior.
Excess tagging disrupts:
- insulin signaling
- blood vessel function
- normal inflammatory balance
It’s subtle but deeply damaging over time.
D) AGEs & RAGE: Sugar-Crusted Proteins That Trigger Inflammation
When glucose stays high, it attaches itself to proteins and fats in a slow, irreversible process called glycation.
This forms AGEs — Advanced Glycation End Products. These are “carmelized proteins” and once sugar sticks to them, they stiffen, age and malfunction.
AGEs:
- stiffen arteries and connective tissue
- damage kidney filters
- cloud lenses in the eye
- bind to a receptor called RAGE (“Receptor for Advanced Glycation End products”)
- RAGE activation triggers a chronic inflammatory cascade
This is a major driver of diabetic complications and biological aging.
3. The Timeline of Glucotoxicity
Even before fasting glucose rises, damage has already started.
Early stage (normal glucose, high insulin)
- You feel fine.
- Labs look normal. (We’re not checking for insulin levels anyway, so the result is that we see no evil!)
- But glucose spillover into toxic pathways is happening silently.
Middle stage (high insulin, rising glucose)
- Polyol, PKC, hexosamine, and AGE pathways accelerate.
- Blood vessels, nerves, and kidney filters begin to show stress.
Late stage (high fasting glucose)
- β-cells are exhausted.
- Organs now show visible injury.
- Diabetic complications appear.
Glucotoxicity starts years before diabetes is diagnosed.
In sum:
When the system is overwhelmed, sugar behaves like a toxin because the pathways meant to handle it are already full.
Understanding glucose spillover clarifies why early insulin resistance matters long before diabetes does.

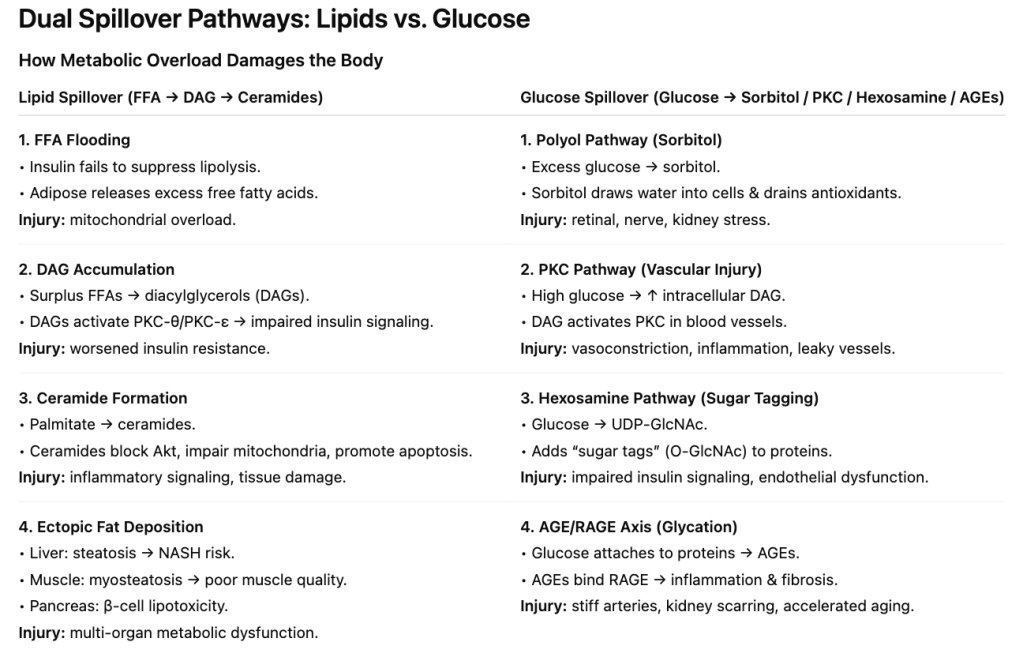
Lipotoxicity:
When fat exceeds handling capacity, it generates signaling lipids (DAGs, ceramides) that block insulin and damage tissue.
Glucotoxicity:
When glucose overflows normal pathways, it diverts into toxic routes (sorbitol, PKC, hexosamine, AGEs) that injure vessels, nerves, and connective tissue.
Together:
These two spillover engines reinforce each other and accelerate metabolic disease long before diabetes is diagnosed.
Ketogenesis — When Your Metabolism Switches Fuels
Your body makes ketones when a very specific set of conditions tells the liver that glucose is scarce, insulin is low, and fat-derived acetyl-CoA is piling up faster than it can enter the TCA cycle.
1) The prerequisites: what must happen before ketogenesis starts
Ketone production requires four metabolic signals happening at the same time:
a) Low insulin
Insulin suppresses ketogenesis at multiple levels:
- shuts down lipolysis → less fatty-acid flux to the liver
- inhibits carnitine palmitoyltransferase-1 (CPT-1) → blocks transport of fatty acids into mitochondria
- downregulates the ketogenic enzyme HMG-CoA synthase
When insulin drops (fasting, low-carb eating, prolonged endurance activity), all three brakes are suppressed.
b) High glucagon
Glucagon rises as insulin falls. Glucagon:insulin ratio is the critical switch.
High glucagon:insulin ratio–>
- activates adipose lipolysis
- stimulates hepatic β-oxidation
- increases availability of acetyl-CoA
- upregulates mitochondrial HMG-CoA synthase 2 (HMGCS2) → the rate-limiting enzyme for ketone production
c) Increased fatty acid flux
Low insulin + higher catecholamines → adipose tissue releases free fatty acids (FFAs).
These FFAs are transported to the liver and oxidized in mitochondria, generating:
- acetyl-CoA (the substrate for ketone synthesis)
- NADH (shifts redox balance to favor ketogenesis)
d) A “backup” in the TCA cycle
If acetyl-CoA arrives faster than oxaloacetate (OAA) can accept it — a common scenario in fasting or low-carb states — the excess acetyl-CoA must go somewhere.
- OAA is diverted to gluconeogenesis.
- The TCA cycle slows.
- Acetyl-CoA accumulates.
Ketogenesis is the overflow valve.
2) The biochemistry
Inside the liver mitochondria:
- Fatty acids → β-oxidation → produce acetyl-CoA
- Acetyl-CoA + acetyl-CoA → acetoacetyl-CoA
- Acetoacetyl-CoA → HMG-CoA via HMG-CoA synthase 2 (HMGCS2) — rate-limiting step
- HMG-CoA → acetoacetate (first true ketone body)
- Acetoacetate → β-hydroxybutyrate (BHB) depending on NAD+/NADH ratio
- Some acetoacetate spontaneously → acetone (exhaled in breath)
The liver cannot use these ketones — it lacks the key enzyme (SCOT). Ketones are exported to other tissues (brain, muscle, heart) for use.
3) When does the body enter meaningful ketogenesis?
A) Overnight fast (8–12 hrs)
- Small rise in ketones — usually < 0.3 mmol/L
- Glucose still available; liver glycogen sufficient
B) 18–24 hours of fasting
- Glycogen depletes
- Insulin drops, glucagon rises
- Ketones reach 0.5–1.0 mmol/L
C) Prolonged fasting (2–3 days)
- Ketones 2–4 mmol/L
- Brain uptake increases substantially
- Significant shift away from glucose oxidation
D) Low-carb / ketogenic diets
- If carbs < 20–30 g/day and protein is not excessive
- Ketones 0.5–3.0 mmol/L
E) Endurance exercise
- Prolonged moderate or high-intensity work depletes glycogen
- Transient ketone elevations even in carb-fed athletes
F) Pathological states
- Uncontrolled diabetes (type 1) → insulin deficiency → ketoacidosis (dangerous)
- Alcoholic ketoacidosis → high NADH favors BHB production
Healthy ketosis is regulated; ketoacidosis is uncontrolled because insulin is absent as in Type 1 diabetes.
4) Why insulin resistance complicates this story
In insulin resistance:
- adipose tissue becomes insensitive to insulin’s anti-lipolytic effect → FFAs leak out
- liver receives excessive FFAs even when fed → episodic ketone spikes
- hepatic insulin resistance + high FFA flux can produce an “inefficient ketosis” — not the stable ketosis of a well-regulated ketogenic diet
This is why many people with poorly controlled type 2 diabetes have higher baseline ketones than lean, healthy individuals — not because they’re “fat-burning machines,” but because their metabolic control is impaired.
5) Why does your body bother making ketones at all?
a) Brain fuel during glucose scarcity
The brain cannot use fatty acids directly (poor BBB transport, mitochondrial constraints), so ketones act as a clean-burning alternative.
b) Protein-sparing adaptation
Ketones reduce the need for amino acids to be converted into glucose via gluconeogenesis.
c) Anti-inflammatory signaling
BHB suppresses NLRP3 inflammasome and modulates immune cell behavior (as covered in Phagocyte).
d) Heart fuel
The failing heart upregulates ketone oxidation — it is oxygen-efficient and supports contractility.
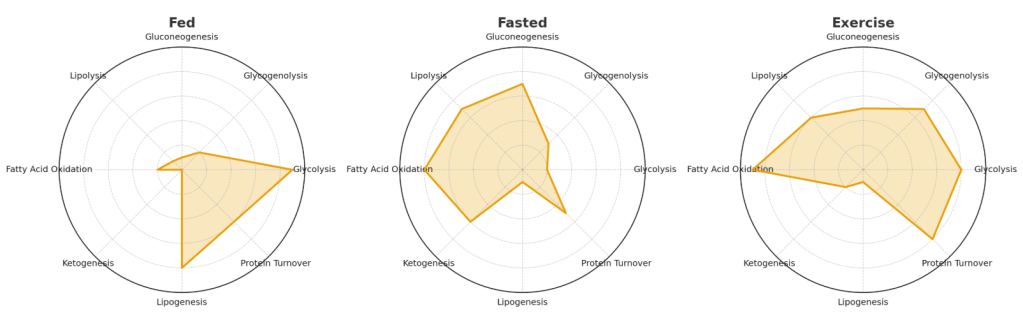
Multiple Metabolic Pathways in Play
One of the biggest misconceptions about metabolism is that it works like a light switch: you’re either burning carbs or burning fat, in “keto mode” or “sugar mode.” The reality is much more fluid. At any given time, your body is running multiple pathways in parallel—storing, breaking down, synthesizing, and burning energy all at once. The balance, not the presence or absence, is what matters.
Here are some of the key processes happening simultaneously:
- Glycolysis: breaking down glucose to generate ATP.
- Glycogenolysis: releasing stored glucose from the liver and muscle.
- Gluconeogenesis: making new glucose from amino acids, lactate, and glycerol—even during fasting or “keto.”
- Lipolysis: breaking down triglycerides in fat tissue into free fatty acids.
- Fatty acid oxidation: burning those fatty acids in mitochondria for ATP.
- Ketogenesis: converting fatty acids into ketone bodies in the liver (especially during fasting or very low-carb intake).
- Lipogenesis: synthesizing new fat when energy is abundant.
- Protein turnover: continuously building and breaking down proteins, adjusting to nutrient status and need.
A healthy, flexible metabolism toggles these pathways seamlessly, matching supply to demand. For example: after a carb-heavy meal, glycolysis and glycogen storage dominate, while lipolysis quiets down. During an overnight fast, gluconeogenesis, lipolysis, and ketogenesis pick up the slack. Exercise layers another dynamic shift on top, rapidly altering the balance of glucose vs. fat oxidation depending on intensity.
Insulin resistance breaks this dance. Pathways that should be dialed down keep firing (hepatic gluconeogenesis, lipolysis), while those that should switch on are blunted (glucose uptake, glycogen synthesis). The result isn’t just “too much sugar” or “too much fat”—it’s the wrong processes running at the wrong times, creating chaos instead of coordination.
This is why diets or fads that frame metabolism as a binary (“on keto” vs. “off keto,” “carbs good” vs. “carbs bad”) miss the point. The truth is that we are always running on multiple fuels. Health depends not on one pathway dominating, but on the body’s ability to flex between them as conditions change.
References
- Shulman GI. “Ectopic Fat in Insulin Resistance, Dyslipidemia, and Cardiometabolic Disease.” N Engl J Med. 2014.
- Czech MP. “Insulin action and resistance in obesity and type 2 diabetes.” Nat Med. 2017.
- Ferrannini E, et al. “Insulin resistance and hyperinsulinemia: the early phase.” Diabetes Care. 2010.
- Samuel VT & Shulman GI. “Mechanisms for insulin resistance: common threads and missing links.” Cell. 2012.
5. Petersen KF & Shulman GI. “Mechanisms of insulin action and insulin resistance.” Physiol Rev. 2018.
6. Holland WL & Summers SA. “Ceramides in metabolic disease.” Nat Rev Endocrinol. 2008.
7. Erion DM & Shulman GI. “Diacylglycerol-mediated insulin resistance.” Nat Med. 2010.
8. Carmen GY & Victor SM. “Adipose tissue lipolysis revisited.” Biochimie. 2006.
9. Guilherme A, et al. “Adipocyte dysfunctions linking obesity to insulin resistance.” Nat Rev Mol Cell Biol. 2008.
10. Cahill GF. “Starvation in Man.” N Engl J Med. 1970.
11. Puchalska P & Crawford PA. “Multi-dimensional roles of ketone bodies in fuel metabolism, signaling, and therapeutics.” Cell Metab. 2017.
12. Hegardt FG. “HMG-CoA synthase genes.” FASEB J. 1999.
13. Fukao T, et al. “Ketone body metabolism and its regulation.” Clin Exp Pharmacol Physiol. 2004.
14. Carpentier AC, Carpentier A. Insulin and adipose tissue fatty acid metabolism: In vivo regulation and mechanistic significance. Am J Physiol Endocrinol Metab. 2021;321(3):E409–E423. doi:10.1152/ajpendo.00620.2020
What about insulin resistance in the brain? Read our Psyche section to find out how central and peripheral IR differ.
Explore more from Issue #2: Beyond Keto: The Real Science of Insulin Resistance
Pick the next section to read in Issue 1
Evidence Distilled. Action Amplified.
