
This is the detailed benchmarking you should do to determine your metabolic health.
Spotting Insulin Resistance Early (Before It Shows Up on Standard Labs)
You don’t need to do everything here, but it will help you see the bigger picture regarding your metabolism.
Why This Matters (Big Picture)
Insulin resistance does not begin with high blood sugar.
It begins with the body quietly working harder to keep blood sugar normal.
By the time glucose rises, the damage is already underway. Remember, normal glucose does not mean you are metabolically healthy.
The Hidden Phase
Hyperinsulinemia is a silent stage.
Blood sugar looks fine. Labs reassure you.
But insulin is doing far more work than it should.
This stage can last years.
1. The Timeline of Insulin Resistance
Phase 1 — Compensation
- Insulin rises
- Glucose stays normal
- The body “looks fine”
Phase 2 — Strain
- Insulin is high most of the day
- Post-meal crashes and cravings appear
- Fat storage increases, especially viscerally
Phase 3 — Failure
- Insulin can no longer compensate
- Fasting glucose rises
- Diabetes is diagnosed
If you’ve ever “suddenly” developed diabetes, it’s because you were never checked for hyperinsulinemia. Diabetes develops over years. Pre-diabetes is still based on glucose measures and should be thought of as an early form of diabetes (not “the stage before diabetes”).
Rethinking “Pre-Diabetes”
Pre-diabetes is not a warning sign before disease. It is an early form of diabetes.
The term pre-diabetes suggests a harmless waiting room — a stage before “real” damage begins. That framing is misleading.
By the time someone meets criteria for pre-diabetes, organ and vascular injury are already underway.

What the science shows:
- Blood vessels:
People with pre-diabetes already show endothelial dysfunction, increased arterial stiffness, and early atherosclerotic changes. These abnormalities predict future cardiovascular disease, even if diabetes never develops. - Heart:
Subclinical changes in cardiac structure and function (including impaired diastolic relaxation) are detectable in pre-diabetes, increasing long-term heart-failure risk. - Kidneys:
Microalbuminuria and early declines in renal function occur more frequently in people with pre-diabetes than in metabolically healthy controls. - Nerves:
Small-fiber neuropathy and autonomic nerve dysfunction have been documented in pre-diabetes, often before overt diabetes is diagnosed. - Brain:
Insulin resistance and glucose dysregulation at the pre-diabetic stage are associated with cognitive decline, white-matter changes, and increased risk of dementia later in life. - Risk trajectory:
Cardiovascular risk rises continuously with glucose and insulin levels — there is no safe threshold where damage suddenly begins at the diabetes cutoff.
In other words, pre-diabetes reflects a system already under metabolic stress with measurable consequences. It is NOT a benign precursor state.
(In clinical practice, when I ask someone if they have diabetes, I often hear No, just pre-diabetes. That just misses the fact that chronic inflammation and organ damage are already underway.)
Why the language matters:
Calling this stage “pre-diabetes” delays urgency, reassurance replaces action, and opportunities for true prevention are missed.
A more accurate framing is: Early diabetes with preserved glucose compensation.
2. The Labs That Actually Tell the Story
A. Fasting Insulin
- Optimal: < 6 μIU/mL
- Concerning: 6–10
- Insulin resistant: > 10–12
High insulin with normal glucose = metabolic strain.
B. HOMA-IR
Calculated as:
(Fasting Glucose X Fasting Insulin) / 405
- < 1.0: insulin sensitive
- 1.0–2.0: early resistance
- > 2.0: established resistance
This reflects how hard insulin is working, not just the outcome.
C. Triglyceride : HDL Ratio
- < 2.0: insulin sensitive
- 2.0–3.5: borderline
- > 3.5: insulin resistant
This ratio is a strong proxy for liver insulin resistance.
Triglycerides — Fasting vs. Non-Fasting (What Each One Really Tells You)
Triglycerides are dynamic.
They rise and fall based on what you ate, when you ate, and how well your metabolism handles fat.
Understanding when they’re measured changes what they mean.
What Triglycerides Actually Represent
Blood triglycerides reflect fat in transit, not fat stored in adipose tissue.
After a meal:
- Dietary fat is packaged into chylomicrons
- These circulate, deliver fat to tissues, and are gradually cleared
But this process isn’t rapid or tidy.
A Key Update to the Old Teaching
It was once assumed that chylomicrons appear after a meal–>circulate briefly–>disappear within a few hours.
We now know:
- Chylomicrons and especially chylomicron remnants can persist for many hours
- Some lipid particles remain in intestinal lymphatics and enter circulation later
- With frequent meals, many people spend much of the day in a post-prandial lipid state
In insulin resistance, clearance is slower — so triglyceride-rich particles accumulate across meals.
Why Non-Fasting Triglycerides Gained Acceptance
Large population studies showed that non-fasting triglycerides:
- predict cardiovascular events and stroke
- reflect real-world exposure of blood vessels to triglyceride-rich lipoproteins
- capture remnant particle burden better than a single fasting snapshot
From a population cardiovascular-risk perspective, this was the rationale.
Non-fasting triglycerides answer the question, how much triglyceride traffic do your blood vessels see across the day?
What Fasting Triglycerides Show (That Non-Fasting Can’t)
After a 10–12 hour fast:
- Chylomicrons are largely cleared
- Triglycerides mainly reflect hepatic VLDL production
Elevated fasting triglycerides suggest:
- hepatic insulin resistance
- increased liver fat
- excess de novo lipogenesis
- impaired suppression of lipid release by insulin
This is why fasting triglycerides track closely with:
- TAG:HDL ratio
- fasting insulin
- HOMA-IR
- fatty liver risk
Fasting triglycerides answer the question how stressed is the liver at baseline?
Why Both Can Be True
These two measurements are not competitors.
- Non-fasting TGs → cumulative daily lipid exposure & vascular risk
- Fasting TGs → hepatic fat handling & metabolic compensation
Which one matters more depends on what you are trying to understand.
Why Fasting Matters for Metabolic Insight
When triglycerides are used to:
- assess insulin resistance
- calculate TAG:HDL ratio
- interpret liver fat dynamics
Fasting conditions provide a cleaner signal.
Non-fasting values may still be informative — but they require context. That’s why I have my patients fast for this test.
Takeaway
- If your goal is cardiovascular screening, non-fasting lipids are often sufficient.
- If your goal is metabolic understanding, request a 12-hour fasting lipid panel.
- Interpret triglycerides alongside HDL, insulin, and glucose patterns — never alone.
Why some of these labs are often not included in discussions with your provider
Most clinicians are trained to:
- diagnose diabetes
- treat high glucose
They are not trained to:
- look for hyperinsulinemia
- intervene during compensation
This is a system limitation (high time for a revision of our guidelines), not a moral failure.
3. What Your Body Shows Before Labs Do
Physical signs often precede abnormal blood work.
Watch for:
- Increasing waist circumference, even with stable weight
- “Skinny-fat” body composition
- Skin tags or darkened skin folds
- PCOS features in women
- Declining testosterone in men
BMI is not a metabolic marker.
4. Energy & Hunger Clues (Often Ignored, Highly Telling)
These are not measures of “weak willpower” or “lack of discipline”. They are physiology.
Red flags include:
- Sleepiness or fog after meals
- Strong hunger 2–3 hours after eating
- “Urgent” cravings
- Energy that depends on frequent snacks
These patterns often reflect glucose–insulin volatility, not moral weakness.
In short, early insulin resistance often feels like
- “I eat and crash.”
- “I’m always thinking about food.”
- “I need snacks to function.”
Again, this is metabolic signaling, not weakness.
5. CGM: Using Real-Time Data (Without Obsession)
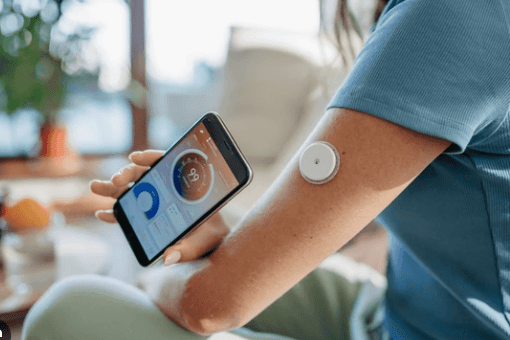
How CGMs Work (and How to Use Them Wisely)
CGMs do not measure blood glucose.
They measure glucose in the interstitial fluid — the fluid that surrounds your cells.
That distinction matters.
Blood vs. Interstitial Glucose (Why the Curves Lag)
- Blood glucose rises first after a meal.
- Interstitial glucose reflects what has moved out of the bloodstream and into tissues.
As a result:
- CGM readings typically lag blood glucose by ~5–15 minutes.
- Rapid spikes or drops may appear delayed or slightly blunted on a CGM.
This is normal physiology — not device error.
For pattern recognition, this delay is acceptable — even helpful.
For acute medical decisions, it is not.
What CGMs Are Good For
CGMs excel at:
- revealing patterns, not point values
- showing relative responses to foods, stress, sleep, and movement
- identifying volatility (spikes, crashes, prolonged elevations)
They are best used as learning tools, not diagnostic instruments.
What CGMs Are Not For
Especially with over-the-counter CGMs (e.g., wellness-focused devices):
- They should not be used for:
- diagnosing diabetes
- adjusting medications
- making urgent medical decisions
About Soreness or Discomfort After Removal
Some people report localized soreness after CGM removal.
What’s likely happening:
- The sensor filament sits in subcutaneous tissue, near small nerves and muscle fascia.
- Muscle contraction during self-removal (e.g., reaching behind the arm and activating the triceps) may tug on tissue during withdrawal.
- Removing the sensor with the arm relaxed and supported may reduce post-removal soreness.
This is a plausible mechanical explanation — not a sign of tissue injury.
Persistent pain, redness, or swelling is not expected and should be evaluated.
Setting Expectations
CGMs are powerful mirrors — not judges.
A spike is not a failure. A flat line is not virtue.
The goal is understanding how your body responds — not chasing “perfect” numbers.
In short, CGMs measure interstitial glucose, not blood, making them excellent for pattern recognition, but inappropriate for medical decision-making without supervision.
What to Watch
- Spikes > 30 mg/dL after meals
- Time above 140 mg/dL > 60 minutes***(see box below)
- Sharp drops below baseline (“crash & crave”)
- Dramatically different responses to similar foods
Simple, Useful Experiments
- Same meal + 10-minute walk
- Carbs alone vs carbs + protein/fat
- Poor sleep vs good sleep
- Stressful day vs calm day
What CGMs Don’t Show
CGMs do not measure:
- insulin levels
- liver insulin resistance
- long-term compensation
They complement labs, not replace them.
When “Normal” Keeps Moving
If you’ve been around medicine long enough, you may remember a time when:
- Post-meal glucose >120 mg/dL raised concern
- Later, 140 mg/dL became the accepted upper bound
- Today, you’ll often hear that up to 180 mg/dL after meals is “acceptable” in modern clinical practice
This shift deserves scrutiny.
1. The thresholds didn’t rise because human physiology changed
Our cells did not suddenly become more tolerant of glucose.
What did change:
- average calorie intake
- meal size and frequency
- carbohydrate density
- baseline insulin resistance across the population
As metabolic disease became more common, the definition of “normal” drifted to match the population, not ideal physiology.
2. Rising thresholds parallel rising disease burden
The timeline is striking:
- As post-meal glucose cutoffs rose, so did:
- obesity prevalence
- type 2 diabetes
- fatty liver disease
- cardiovascular disease
This doesn’t prove causation — but it does suggest that “normal” has become a statistical average, not a marker of metabolic health. Another way to think about this is that if you’re “normal”, you’re as unhealthy as most people.
3. These cutoffs are pragmatic, not sacred
The 180 mg/dL post-prandial threshold is not a biological cliff.
It’s a clinical compromise.
Why it exists:
- to manage population-level care
- to avoid labeling a majority of adults as metabolically abnormal (even if it’s true)
- to focus limited resources on those at highest immediate risk
This makes sense for public health triage.
It is far less satisfying for personal physiology.
4. CGMs expose what population medicine smooths over
Continuous glucose monitoring reveals something clinic snapshots miss:
- large post-meal excursions
- repeated daily spikes
- prolonged time above baseline
Even when fasting glucose and A1c are “normal.”
From a CGM perspective, the question is not did you cross a diagnostic threshold ? but how often, how high, and how long does your glucose remain elevated?
That’s a different — and more nuanced — question.
5. The uncomfortable implication
If we held post-meal glucose targets at 120 mg/dL, many modern eating patterns would immediately appear excessive.
That’s not a moral judgment. It’s a metabolic reality.
Raising thresholds has, in part, allowed us to:
- normalize overconsumption
- delay intervention
- frame disease as inevitable rather than cumulative
Again: this is not about blame — it’s about honesty. It’s easier to get an A in your metabolic health because we lowered the bar, not because you got any healthier. If you’re wondering why we’re getting sicker and sicker it’s because our standards reflect what we get in life (and health).

Takeaway
- Higher post-meal glucose targets reflect population management, not optimal biology.
- A CGM is not meant to enforce perfection, but to reveal patterns.
- Occasional excursions happen. Chronic, repeated spikes matter more than any single number.
6. Non-Food Drivers That Worsen Insulin Resistance
Even with “good” nutrition, insulin resistance can progress due to:
- short or irregular sleep
- chronic psychological stress
- overtraining without recovery
- late-night eating
- alcohol (even moderate use)
7. The Goal of This Supplement
This is not about fear or control.
It’s about answering one question: Is my metabolism silently compensating, or genuinely flexible?
That answer determines what comes next.
Takeaway
Early insulin resistance is detectable, reversible, and often missed.
Seeing it early gives you choices.
Waiting until glucose rises removes them.
A Gentle Bridge Forward
Once insulin resistance is identified, improvement requires:
- nutrition strategy
- movement programming
- sleep and stress regulation
- interpretation of feedback over time
That process is difficult to do alone — not because it’s extreme, but because it’s dynamic. See week 2’s supplement for your action guide to better insulin sensitivity.
References
- Reaven GM. Insulin resistance: the link between obesity and cardiovascular disease. Med Clin North Am. 2011;95(5):875–892.
- Kraft JR. Detection of diabetes mellitus in situ (occult diabetes). Lab Med. 1975;6:10–22.
- Shanik MH, et al. Insulin resistance and hyperinsulinemia: is hyperinsulinemia the cart or the horse? Diabetes Care. 2008;31(Suppl 2):S262–S268.
- Ferrannini E, et al. Insulin resistance, hyperinsulinemia, and blood pressure. Hypertension. 1997;30(5):1144–1149.
- Tabák AG, et al. Prediabetes: a high-risk state for diabetes development. Lancet. 2012;379(9833):2279–2290.
- Huang Y, et al. Prediabetes and the risk of cardiovascular disease: a meta-analysis. J Am Coll Cardiol. 2016;67(11):1273–1283.
- Plantinga LC, et al. Pre-diabetes and risk for chronic kidney disease. Clin J Am Soc Nephrol. 2010;5(4):673–680.
- Smith AG, et al. Peripheral neuropathy in prediabetes. Diabetes Care. 2006;29(6):1294–1299.
- Crane PK, et al. Glucose levels and risk of dementia. N Engl J Med. 2013;369(6):540–548.
- Ginsberg HN, Packard CJ, Chapman MJ, et al. Triglyceride-rich lipoproteins and their remnants: metabolic insights, role in atherosclerotic cardiovascular disease, and emerging therapeutic strategies — a consensus statement from the European Atherosclerosis Society. Eur Heart J. 2021;42(47):4791–4806.
- Parvaresh Rizi E, et al. Two-Hour Postprandial Lipoprotein Particle Concentration Following Meal Challenges in Obese Insulin-Resistant vs. Lean Insulin-Sensitive Subjects. Front Physiol. 2019;10:856.
- Otvos JD. Measurement issues related to lipoprotein heterogeneity. Clin Chem. 2002;48(11):1789–1797.
- Ma S, et al. Biomarker Discovery in Atherosclerotic Diseases Using Lipoprotein Particle Profiles by NMR. Front Cardiovasc Med. 2021;8:681444.
- Mora S, et al. Lipoprotein Particle Profiles by Nuclear Magnetic Resonance and Cardiovascular Risk in Women. Circulation. 2009;119(22):2790–2797. PMC
- Chait A, et al. Remnants of the Triglyceride-Rich Lipoproteins and Cardiovascular Disease. Diabetes Metab Res Rev. 2020;36(S1):e3270. PMC
- McLaughlin T, et al. Use of metabolic markers to identify insulin resistance. Ann Intern Med. 2003;139(10):802–809.
- Hadaegh F, et al. Triglyceride/HDL cholesterol ratio and insulin resistance. Metabolism. 2009;58(5):607–613.
- Adiels M, et al. Overproduction of VLDL triglycerides in insulin resistance. Arterioscler Thromb Vasc Biol. 2008;28(7):1225–1236.
- Heinemann L. Continuous glucose monitoring (CGM): interstitial glucose physiology. J Diabetes Sci Technol. 2010;4(4):952–960.
- Basu A, et al. Time lag of interstitial glucose relative to blood glucose. Diabetes. 2013;62(3):840–847.
- Rodbard D. Continuous glucose monitoring: a review of recent studies. Diabetes Technol Ther. 2016;18(S2):S3–S12.
- Cavalot F, et al. Postprandial blood glucose is a stronger predictor of cardiovascular events than fasting glucose. Diabetes Care. 2006;29(3):523–528.
- Monnier L, et al. Contributions of fasting and postprandial glucose to HbA1c. Diabetes Care. 2003;26(3):881–885.
- Hanefeld M, et al. Postprandial hyperglycemia and cardiovascular risk. Diabetes Res Clin Pract. 2004;64(S2):S103–S108.
- Carpentier AC, Carpentier A. Insulin and adipose tissue fatty acid metabolism: in vivo regulation and mechanistic significance. Am J Physiol Endocrinol Metab. 2021;321(3):E409–E423. doi:10.1152/ajpendo.00620.2020
Too much? No time to run around and get those labs, or perhaps you can’t get an appointment with your doctor till next year? As always you can default to the Life is Short List anytime. Life is for living, after all!
See you next week!
